For a quick snapshot of how the economy is performing in Richmond, and in the surrounding Metro Vancouver region, the City of Richmond’s Quarterly Economic Report has got you covered. In this report you’ll find up-to-date statistics and analysis on key economic indicators including housing and development, tourism and trade, business growth, commercial space and more. Here are some highlights from the third quarter of 2018.
Housing Starts & Construction Activity
- Bucking the regional and provincial trend, construction of new
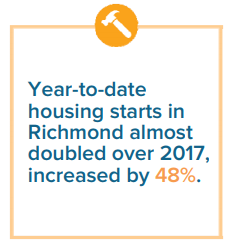
homes in Richmond, particularly condos, continued to surge in the third quarter of 2018. - Year-to-date housing starts in Richmond nearly doubled over 2017 levels, increasing by 48%. Q3 2018 alone saw a 16% increase over Q3 2017.
- This is in stark contrast to regional totals, where housing starts
declined by 4.5% over Q3 2017. Overall, 2018 year-to-date housing starts in Metro Vancouver increased by a mere 0.2% over the same period last year. - In total there were 857 residential building permits, 329 commercial building permits, and 88 industrial building permits issued in the first three quarters of 2018
Real Estate
- Tougher mortgage qualifications, rising interest rates and
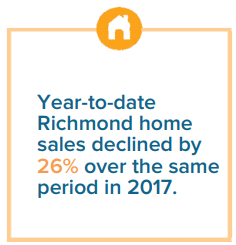
government tax measures have contributed to another period of slowed housing demand. 2,553 homes were sold in Richmond throughout the first nine months of 2018, a 26% decline over the same period last year. - The detached home category saw the biggest decrease in sales, at 41%, followed by townhouses (down 37%) and apartments (down 30%).
- At the end of Q3 2018 the average price of a detached home in Richmond was $1.78 million, while a townhouse was $870,000 and
an apartment was $587,000.
Goods Movement
- After posting a year of strong growth in 2017, regional cargo data indicators of regional trade activity continued to demonstrate solid year over year growth in Q3 2018.
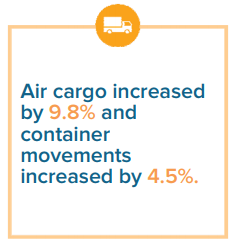
- Port of Vancouver container movements as measured by TwentyFoot Equivalent Units (TEUs) increased by 4.5% over the same period last year.
- 252,822 tonnes of air cargo moved through the Vancouver
International Airport (YVR) in the first 9 months of 2018, a 9.8%
increase over the same period last year.
—
Posted January 10, 2019
View the Complete Report
Click on the report cover below for a link to the complete Quarterly Economic Report.


